One of the challenges in proteomics experiments has always been determining which measured zeros represent a meaningful change and which are the results of sampling error. In many areas, such as phosphoproteomics or chemoproteomics, missing values can be biologically meaningful. A signal disappearing after treatment might reflect a real effect–like a change in phosphorylation state or competition of a probe–not just a technical dropout. The limit of quantitation (LOQ) is the smallest signal that can be reliably measured by the instrument and it is the key to determining which dropouts are meaningful.
But here's the problem: most people have been looking for the LOQ in the wrong place.
In DIA or label-free DDA experiments, there can be too much noise in the m/z region of a given peptide to reliably identify the signals from a target peptide. This results in a peptide-specific LOQ, where the minimum detectable intensity varies across peptides depending on how clearly their signals can be separated from the local noise [1].
Isobaric proteomics is different. The scan region containing reporter ions is much less crowded and the reporter ions are found at known, unique mass-to-charge values. In theory, there should be one universal detection limit, corresponding to the minimum number of reporter ions required to generate a signal, that applies to every peptide.
In practice, most researchers are still seeing peptide-specific limits because they’re looking at the wrong measurement.
The global LOQ has been hiding in plain sight. The key insight is that a mass spectrometer’s lower threshold is based on the minimum number of ions required to generate a signal. This threshold gets masked, however, when looking at intensities because intensities are adjusted by ion injection times. Varying ion injection times produce very different minimum intensities.
Here’s a simple analogy: catching 100 raindrops in 1 second tells you it's raining harder than catching 100 raindrops in 10 seconds. The same number of drops (ion counts), give represent very different intensities.
Some authors use signal-to-noise ratio as a surrogate for ion count, but we use defluxed intensities, which are simply intensity multiplied by ion injection time.
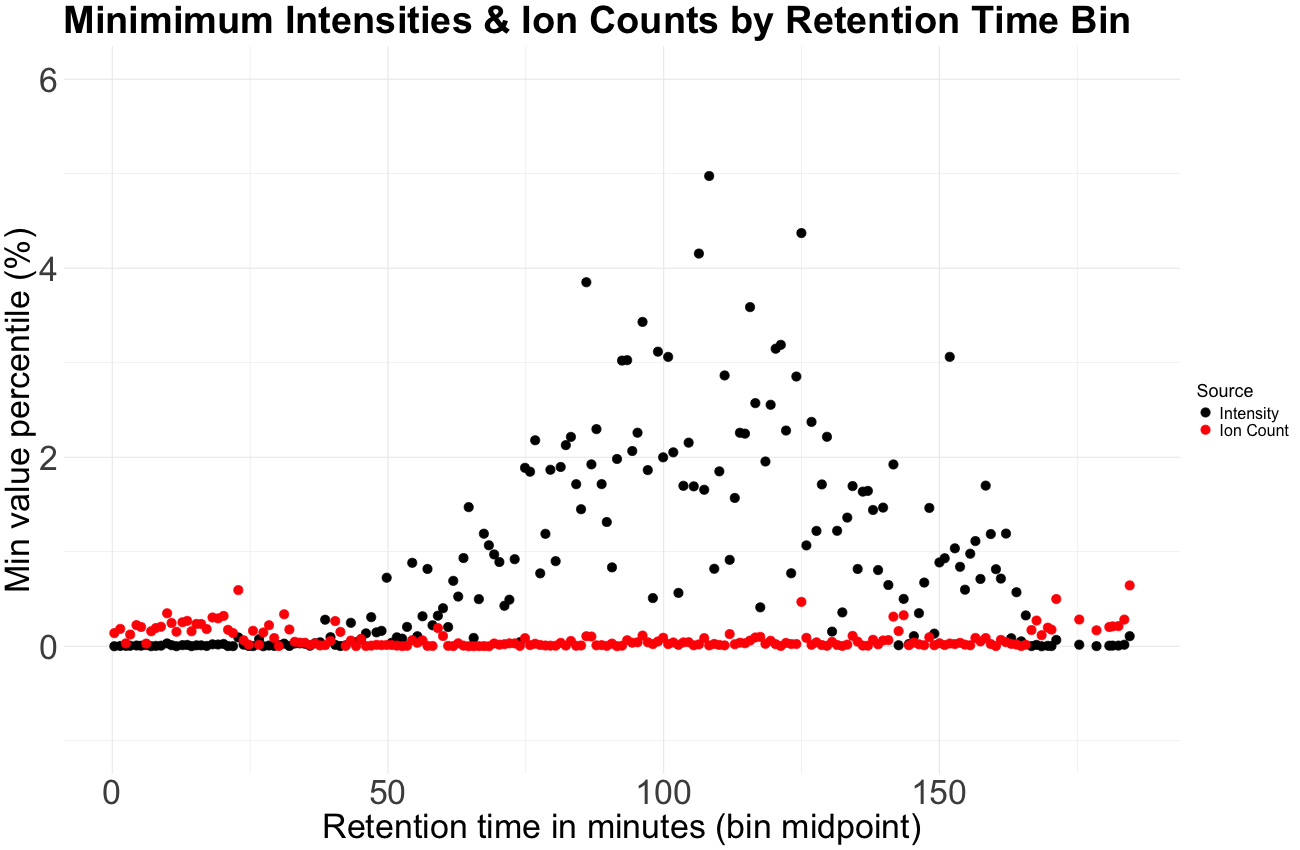
Figure 1: For an experiment with large fold-changes, we expect each sufficiently large sampling of peptides to contain a measurement from the minimum number of detectable reporter ions. We binned intensities and ion counts by retention time. For each bin, we plotted the minimum value as its percentile rank in the entire dataset. Ion counts show a consistent minimum across retention time while intensities do not. The minimum number of detectable ions is relatively consistent while the minimum intensity is not, due to varying ion injection times.
When we plotted minimum ion counts (defluxed intensities) across different retention time bins, something remarkable appeared: a consistent floor. Essentially the same minimum ion count was seen, for all retention times, across the entire experiment. When we plot intensities in a similar fashion, we do not see a consistent minimum across retention times. When considering ion counts, instead of many different limits, we had one.
Some data processing steps, like column normalization or the isotope impurity correction, can also hide the global LOQ. The isotope correction, in particular, can introduce large errors in low-abundance signals when there are big differences between sample groups [2]. Since finding the LOQ is about identifying the smallest reliable signals, it’s important to look at the raw, unadjusted data. In fact, when we plot the lowest ion counts and intensities across retention time, we only see a clear minimum (or "floor") in the unadjusted data—not in the isotope adjusted version (see Fig. 2).
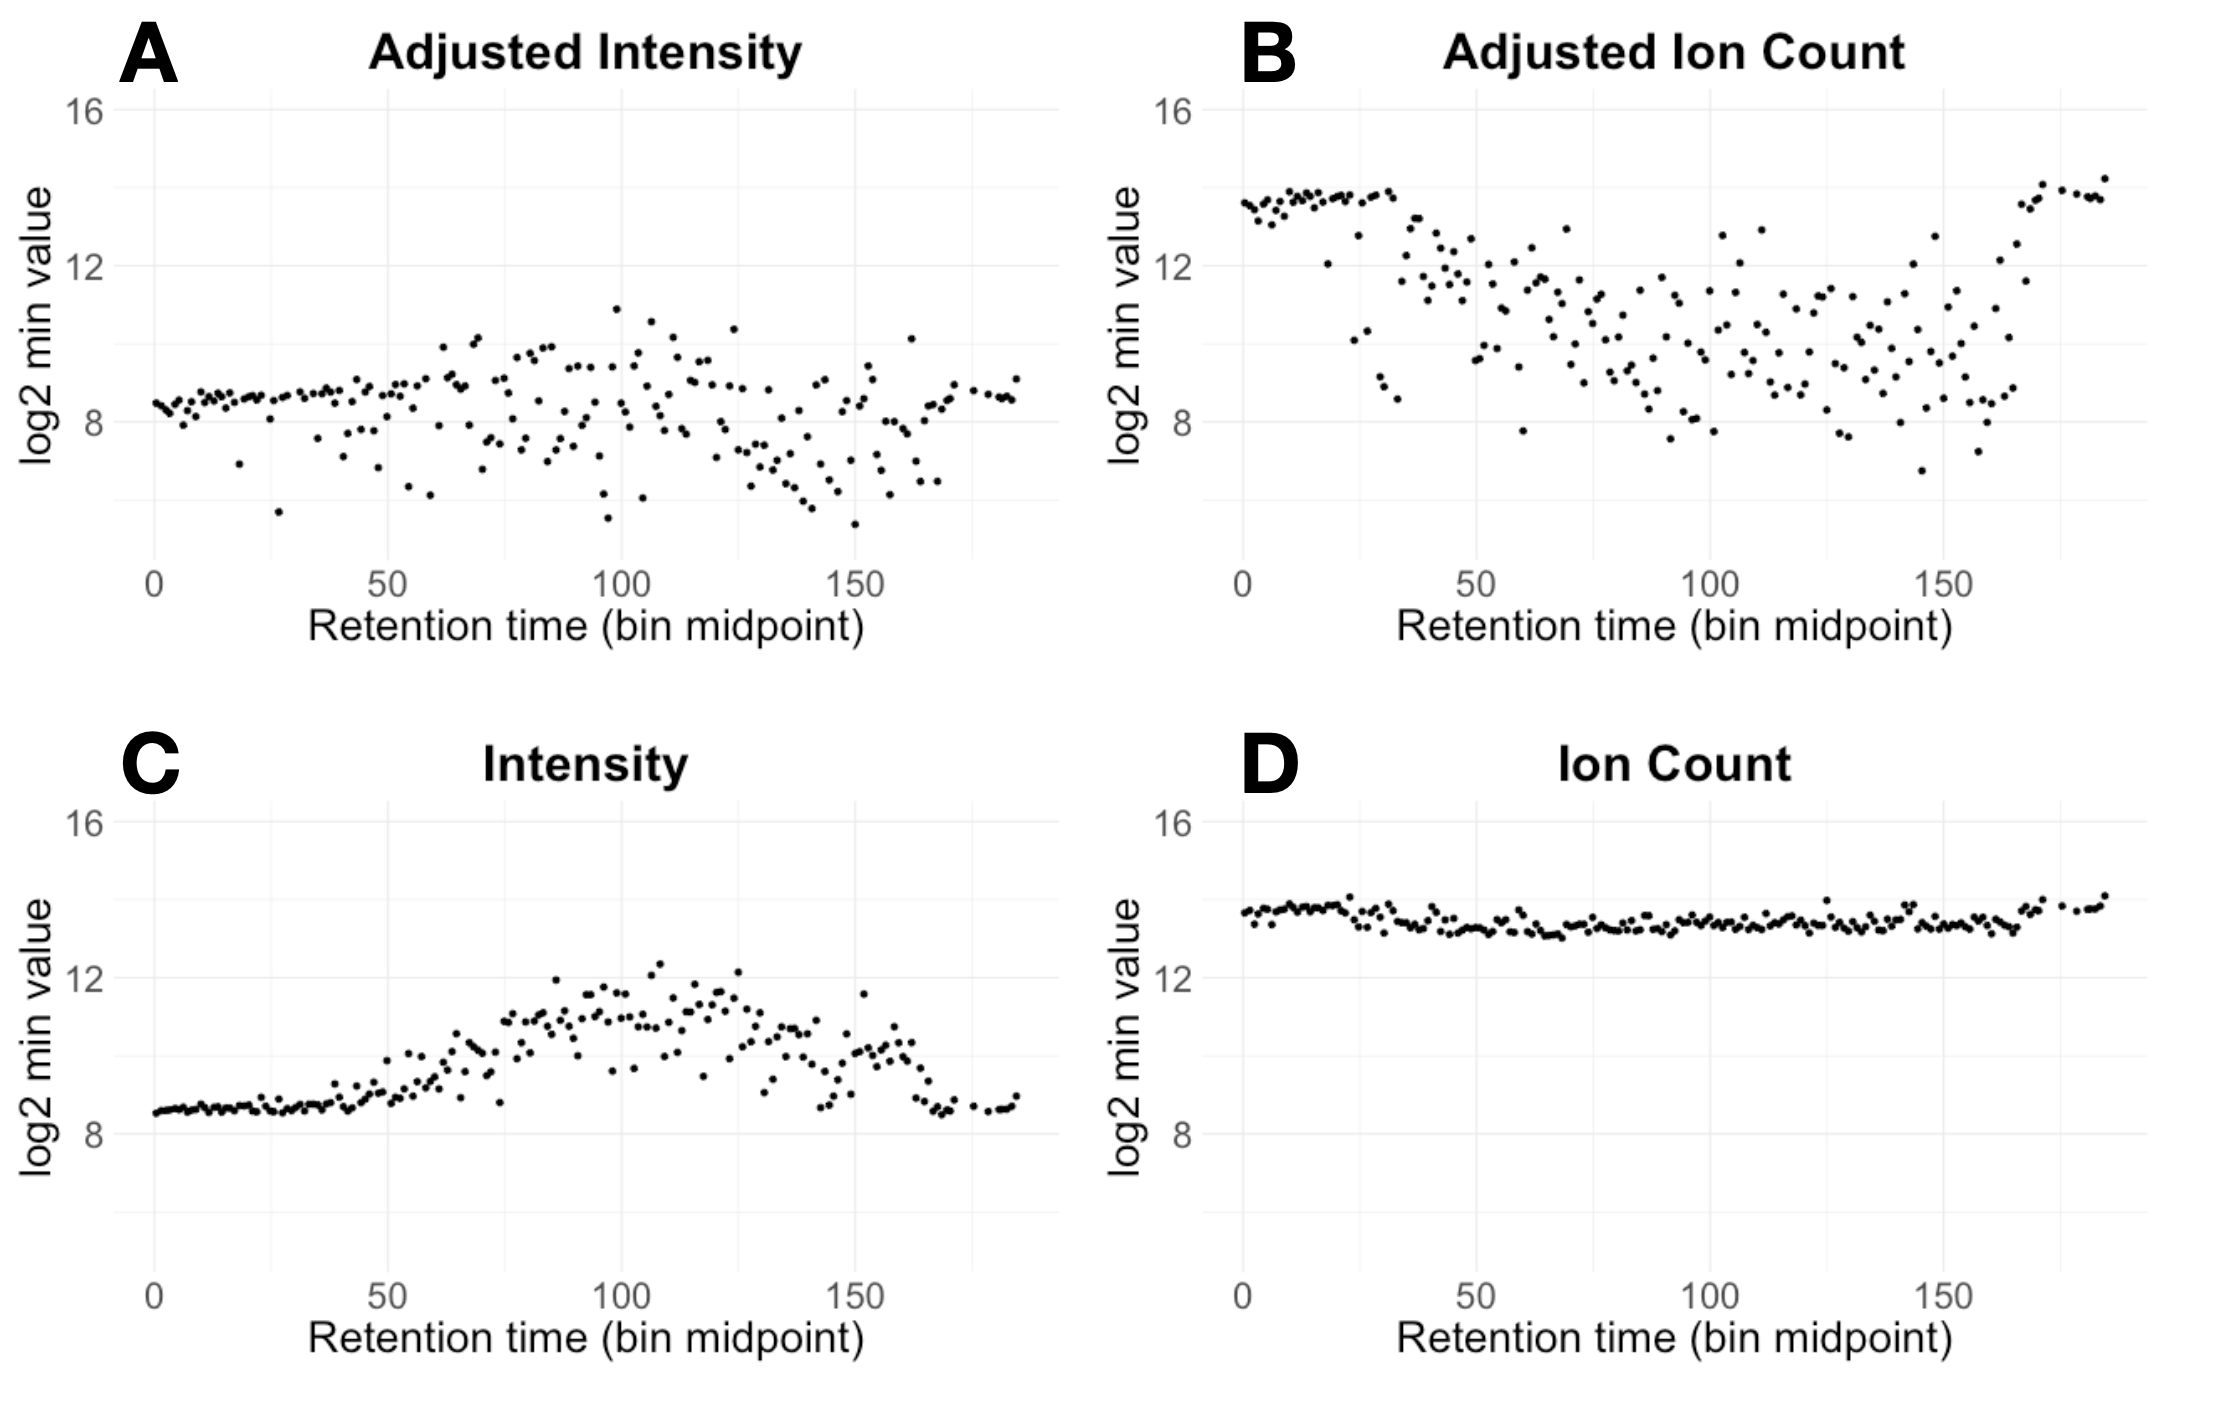
Figure 2: Minimum value for each retention time bin for four cases. Panels A & B show intensities and ion counts for isotope adjusted data. The isotope impurity correction can cause small outliers, so in many retention time bins the recorded minimum is skewed by the isotope correction. The unadjusted data in panel D show a relatively consistent minimum ion count across retention time.
We use de-fluxed intensity —intensity multiplied by ion injection time— as a surrogate for ion count, so the minimum ion counts are higher than the minimum intensities because, for small measurements, the ion injection time is almost always greater than one.
We use this global LOQ in many aspects of our pipeline. In future posts we will describe how we use it to:
These aren’t just technical curiosities—they’re the foundation for distinguishing between meaningful occupancy and random noise in studies of post-translational modifications and chemoproteomics screens.
Ready to see what your missing data really means?
Contact us if you would like to learn more about what’s possible when you know your true detection limit.